

Words and Photos by Caleb McDaniels @calebjmcdaniels
 A three-mile-wide tongue of ice reached down from the Greenland Ice Sheet to the east, filling the valley below me. From this glacier, a churning, gray meltwater river roared forth on its journey to the waters of the Davis Strait. As I picked my way down the slope, stepping and sliding on clumps of wet moss, I came to a particularly fruitful patch of bilberries and sat down to collect a few. Though I had passed through the small town of Kangerlussuaq only four days before, I had eighteen days of walking and packrafting between me and my next resupply. I was in no position to turn down a handful of berries.
 This was the second time I had descended this particular hillside, and I would soon inflate my packraft and paddle out onto the river to take water samples, just as I had done two years before. In 2023, I traveled to Greenland to gather sediment data for my professor’s remote sensing research. He needed samples from Greenlandic rivers to ground truth satellite imagery, allowing data on rivers’ sediment loads to be extracted from weekly satellite scans. Gathering the samples by foot and packraft was far more economical than using helicopters and exponentially more fun. That summer, I hiked and packrafted over 700 miles along the edge of the ice sheet, sampling rivers and wandering over the tundra with the caribou herds.
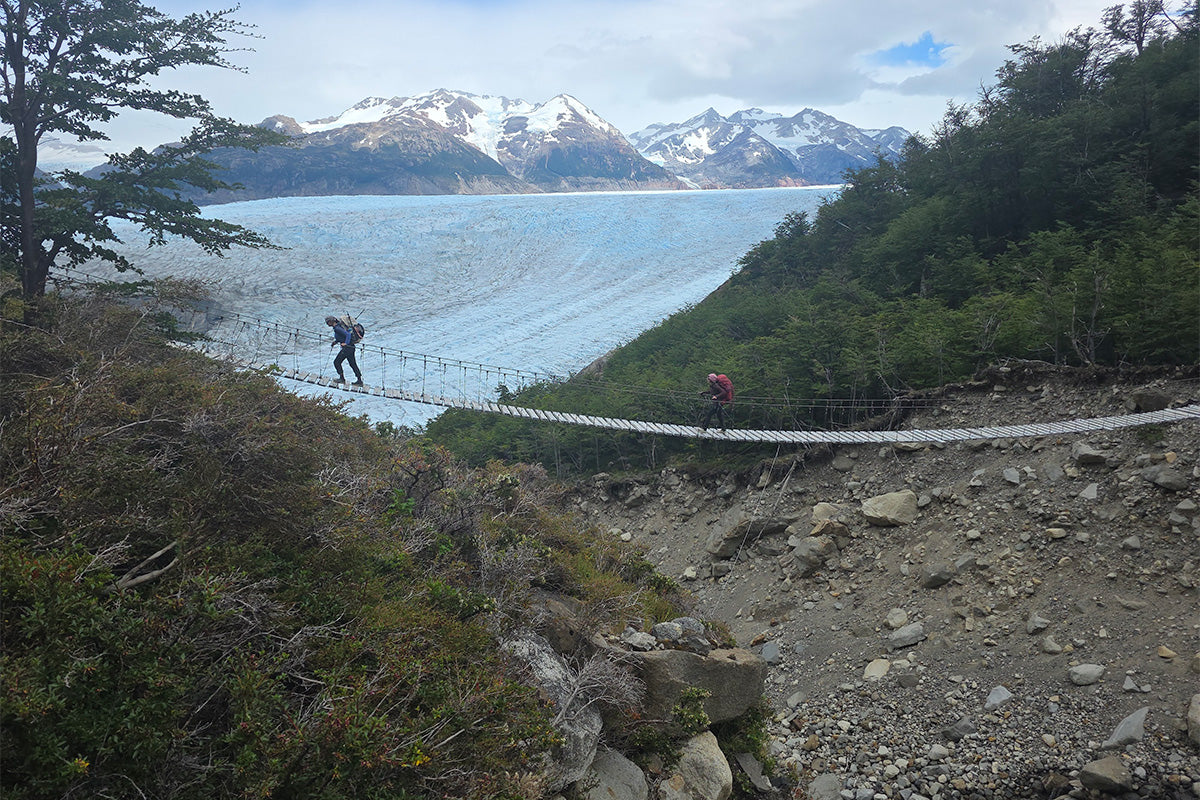
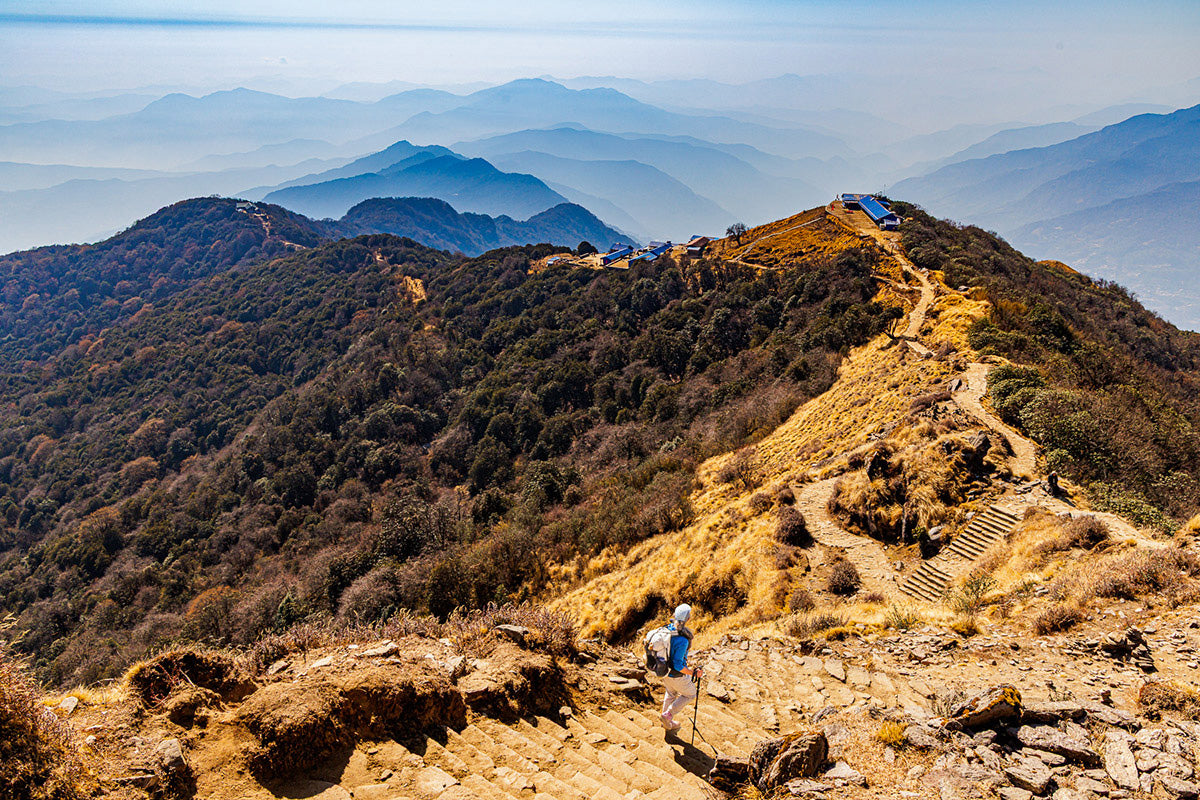
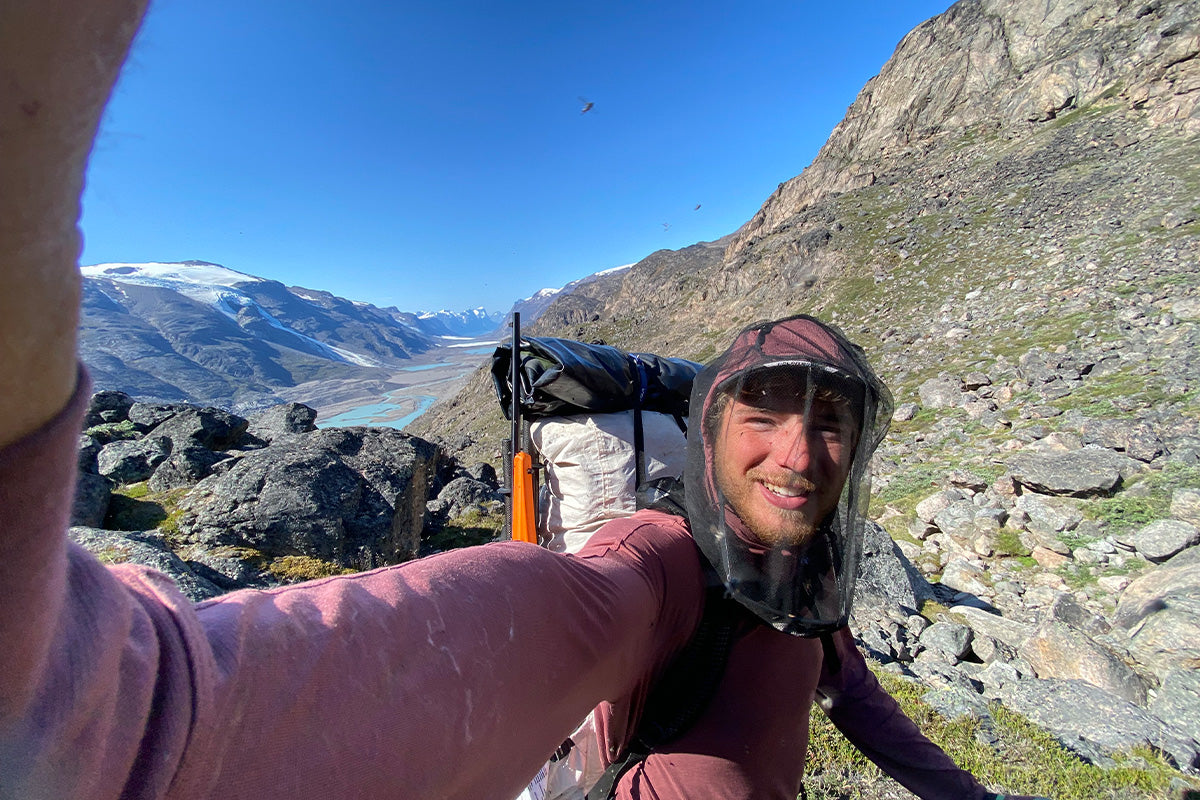
 Hiking between river systems amid clouds of mosquitoes.
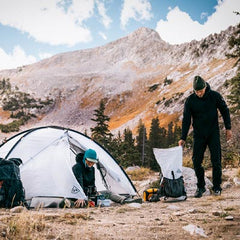
Now 800 miles into my third summer on Greenland’s west coast, I had begun hiking and packrafting north from Nanortalik, the southernmost town on the island. Each crossing of a fjord, lake, or river was an opportunity to test an optical sensor I designed to measure the concentration and size of sediment particles in the water. When passing through areas that overlapped with my 2023 traverse, I returned to sample the same rivers again.
 Once I had eaten my fill of bilberries, I continued on down the slope to the riverbank. There, I set down my pack and inflated my packraft, my boots sinking into the silt. This riverbank was made of fine particles of sediment known as glacial flour. These particles are bedrock that has been pulverized by the slow movement of the mile-thick ice sheet and ground down to a soft, flour-like texture. When snow and ice on the surface of the ice sheet thaw, the meltwater flows through cracks in the glacier down to the ice-bedrock interface below. There, it picks up these bedrock particles and carries them through sub-glacial waterways and out into rivers like this one.
 A small meltwater stream near the edge of a glacier.
While the rivers may look uniformly grey with sediment from a distance, that sediment varies significantly and carries important information. We can’t directly measure much of what is happening beneath the ice sheet, but we can measure the sediment carried by its rivers—either by sampling on site or using satellite images taken every few days. Changes in a river’s sediment load can help estimate patterns of surface melt and meltwater flow. The size distribution of sediment particles offers clues about the structure of sub-glacial drainages, which influences the speed of glacial movement. Even whether the glacier is sliding over hard rock or soft sediment can be inferred from what rivers carry. In effect, the sediment in these glacial rivers provides a momentary cross-section of the glacier’s internal state, capturing how water, ice, and bedrock are interacting at that point in time.
 Sediment-laden rivers flowing from the ice sheet to a fjord in western Greenland. The slightly different colors of the two rivers, indicating different sediment loads, and the sediment plumes in the fjord, can be seen in this satellite image from the Sentinel-2 satellites.
Before launching my boat, I paused for a moment to listen to the water. While some rivers gurgle and others roar, Greenlandic rivers hiss. Constant collisions of particles in the water, from glacial flour to gravel and boulders, create an ever-present wall of sound. Once I was out in the middle of the river, it was time to take a water sample. I marked a GPS point and dunked a bottle into the grey water. I filled a syringe from the bottle and began squeezing the water through a filter. As I floated past towering banks of undercut permafrost, I watched the white disk of filter paper inside its plastic casing rapidly turn grey with sediment. Two weeks of abnormally warm, 65 ˚F weather had led to high surface melt rates on the ice sheet, which in turn resulted in an increase in flow through the subglacial drainage system. More water flowing beneath the ice meant more sediment was picked up and carried into this river, resulting in these particularly high suspended sediment loads.
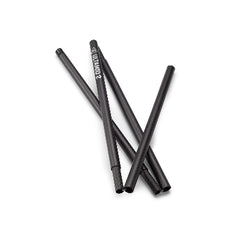
 A clean, unused filter and a grey, used filter after sampling.
Just as a heatwave produces short term spikes in meltwater flow and sediment transport, the warming Arctic climate will amplify these patterns over longer timespans. Increased surface melt, combined with a longer melt season, will drive ever greater volumes of water and sediment down these rivers year after year. This sediment doesn’t disappear when it gets to the ocean. While Greenland contributes only 1% of freshwater flowing into the world’s oceans, it supplies roughly 8% of river-borne suspended sediments. That sediment provides mineral nutrients to marine ecosystems, reshapes fjord bathymetry, and alters light levels in coastal waters.
 A raging glacial river after a hot July day.
As climate change accelerates ice sheet retreat, increased meltwater and suspended sediment flow will have varied effects on local ecosystems. In some cases, greater discharge from marine-terminating glaciers will enhance upwelling in fjord ecosystems, bringing nutrients to the surface where phytoplankton and the entire ecosystem benefit. In other cases, high concentrations of fresh, sediment-laden water may settle on the surface of fjords, blocking out the light that phytoplankton depend on.
 Formerly marine-terminating glaciers in the process of retreating onto land.
For Greenlandic communities whose economies and food systems depend on healthy fjords, even subtle shifts in meltwater and sediment can carry outsized consequences. Making sense of these changes requires better data—and that means combining approaches. Satellites pass overhead, imaging the landscape in swaths 115 miles wide, tracing sediment flow across entire river systems. But from orbit, a river is only a ribbon of color. Understanding how warming is changing these waters depends on both the satellite's broad view and ground-truthing data gathered footstep by footstep, river by river. So I paddled on, taking more samples as I drifted downstream.
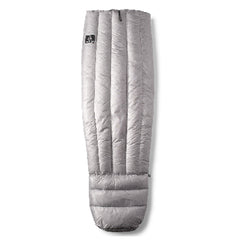
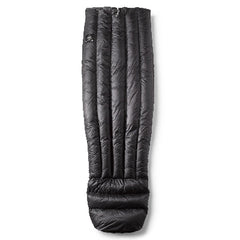
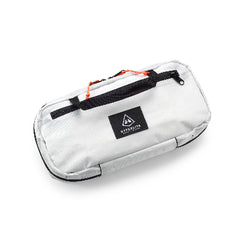
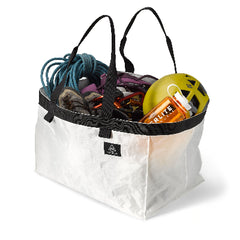
 A full pack with two weeks of food, sampling supplies, and a packraft.
I let the river carry me along for a few more miles, the light softening as the long Arctic day came to an end. Despite shivering through days of sleet and pushing through long, sore-footed miles, this serenity of fjords and tundra had captured my heart. Gradually, the tall permafrost banks gave way to low gravel bars, and the river fanned out into a maze of braided channels. Catching an eddy on the far shore where a stream splashed into the river, I clambered out of my packraft and drank deeply from the clear water before pitching my tarp for the night. Tomorrow, I would roll up my packraft, shoulder my 70-pound pack, and walk for two days to the next river. There, I would repeat the process of floating and sampling. The weight of food in my pack would be replaced by vials of water and hungry daydreams of my next resupply. I would continue hiking northward for hundreds more miles. Beyond the next pass, another river would be waiting.